We’ve just come out of Roy Morgan’s State of the Nation, focusing on consumer financial behaviour in Australia, and we wanted to bash out our very own ‘quick and dirty’ update on the key insights as we saw them.
Insight: According to Roy Morgan’s State of the Nation Finance Report, Australian wealth is continuing to grow more than debt.
Data: The average per capita net wealth is 30.5% higher in 2017 than it was in 2007 in inflation adjusted terms.
Key Action Point: For more insights, download Roy Morgan’s State of the Nation Finance Report for more information.
Note that this is our own interpretation; if you want to dive deep into the report, you can visit their page. Of course, you are welcome to get in touch with us to discuss any of these points.
The data compares our recent point in time with the data from 2007.
A Glimpse of Consumer Financial Behaviour in Australia
- Net wealth is up and nearly double, and we’ve pulled up well after the GFC, despite commentary in the media about rising debt levels (up 18% since 2007); they’re often not compared to the rising asset levels (up nearly 50% since 2007). Net wealth is the key metric to look at.
- Since 2007, Total Net Wealth has increased from $4.3 trillion to $8.4 trillion
- Per person, there’s an increase from the mean from $252,000 to $415,000 (+65%)
- Obviously, like many OECD countries, wealth is not equally distributed. The wealthy have gained the most, but all deciles have benefited across the country in terms of wealth and growth.
- The 80/20 rule is not far off for us as a nation — it’s 70/30. To give that some more detail, the top 10% has 50% of the wealth, and the second 10% has 20% of the wealth. This means the top 20% has 70% of the wealth. There are no surprises here. It’s a stark reality.
What Are the Drivers of Wealth?
Property
- Still the largest pool of wealth but home ownership is in decline. It’s a big shift for us. Since 2007, it has fallen from 72% to 65%.
- Growth in mortgages is mainly driven by population growth in capital cities.
- Total loans are up, driven by investment properties.
- The value of the average home loan has doubled.
- We are holding mortgages for longer, and we’re using them as financial instruments to do other things (eg. set the kids up, invest, etc.)
- The number of people that go into the banks vs other channels is down significantly. Almost half of the loans are coming through brokers, which means banks and customers are even more disintermediated.
- The internet is becoming the channel du jour for mortgages.
- Mortgage stress is present, and the commentary around a looming around property crash is ever present.
- Key stats on the percentages of people ‘at risk’ if there was a large correction:
- 20.6% (1 in 5) could be ‘at risk’ with 13.6% that would be considered ‘extremely at risk’. These are the much commented on “mortgage prisoners” who couldn’t refinance due to personal circumstances if there was a major correction.
- Overall, mortgage risk and stress is down since the GFC.
- All NPS for mortgage suppliers were below zero.
- The evolution of the broker channel (and brokers themselves) is still underway, and there are questions on how it will affect pricing.
Superannuation
- Superannuation is the second largest pool of Australia’s wealth (still).
- The industry funds now officially own the landscape. 50.4% of funds are with an industry fund, 21% with the retail fund, 15% with a public offer, and the final 4% with self-managed super funds (SMSF).
- The big balances obviously are with SMSFs, with an average level of funds at approximately $330,000, and the industry funds have an average of $107,000.
- This means that industry and retail funds are really on neck and neck.
- Employers and employment status continue to be the major drivers/triggers.
- In terms of satisfaction, the public sector funds are the only funds with an average Net Promoter Score above zero (which means everyone else has an average Net Promoter Score below zero! (Yes, I said the same thing twice.) And if you consider this against Apple’s at its peak of approximately +70, it’s very worrying news.
Asset Classes
- The top asset classes are no surprise, and they have grown quickly. They are in order: owner-occupied homes, super, property investment.
- However what is interesting is the share of asset classes, which has had some major shifts.
- What is up?
- Super has increased a little in terms of share, driven by more people being in the workforce and for longer.
- Property investment is up a little bit.
- It’s important to remember these things move slow.
- What is down?
- Owner-occupied home ownership is down slightly as our managed funds, pensions, and annuities.
Debt
- Our largest pool of debt is owner-occupied mortgages, which is up at 69%. But share is down.
- The second pool are mortgages and investment properties, which is up 111% and is the largest single increase. So there is a shift here.
Net Promoter Score
- Since 2007, the banks have shifted from satisfaction as their key focus to growth.
- We saw Net Promoter Score become very popular; it was a metric that was so quickly adopted and even used to measure senior executive bonuses. But this caused it to move away from being about the customer.
- So while NPS continued to go up in the sector, there was a call from the royal commission and an absolute crisis of trust.
- It’s the new players that are winning in this landscape — the offshore options, the Fintechs, the disruptors, the customer service-focused, the online. On average, they have an NPS of around 60, which makes some of the sector’s net promoter scores look dire.
- Interestingly, satisfaction is not rational (only). Some of the highest Net Promoter Scores go to people like the Bendigo Bank, with a strong focus on community, and brands like ING that are totally digital and customer service-led and, in fact, have headquarters in the Netherlands (which means the rational ability to see inside and trust the business is low).
- Roy Morgan’s position on trust is that it is a hygiene factor. It is the minimum. It is ‘game on’. Thus, they assert that distrust, which is the climate we are enduring at the moment, is ‘game over’. It impacts churn, acquisition, satisfaction, and engagement, amongst others.
- Enter the new Roy Morgan Net Trust Score, which is well worth checking out.
- Leading industries in the race for the most distrusted organisations are in this order:
- Banks
- Telcos
- Mining
- Media
- Utilities
- Government insurance
- Pharma
- Gambling
- The most trusted organisations are:
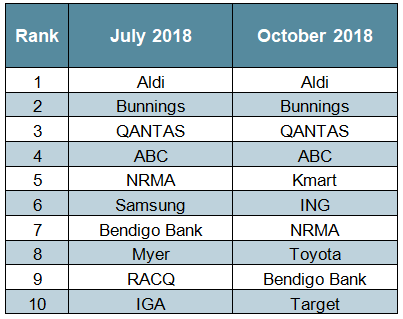
- The drivers of trust are operations and cultural. They are customer service, quality products and services, ethical behaviour and integrity, community vs institution.
- Drivers of distrust are self-centredness, company greed and dishonesty, and unethical behaviour. Although Australians have, in some ways, a reduced (rational) ability to measure trust with certain players like digital players and offshore banks (yet they have an NPS of 60), these players are leading the trust game.
- Trust no longer equals heritage, solidness, size, bricks and mortar — it’s driven by purpose and customer experience.
- Change drivers in the near future will be legislation, data, disruption, the evolution of brokers and pricing, and customer expectation.
The information I have above has been captured quickly. We’ve done everything to ensure that it is accurate. However, obviously, when noted down on the fly, mistakes happen.
A big thank-you to Roy Morgan for the wonderful event.
If you want to learn more, you can get the full data and see what they can do to cut and split this data to answer your questions and model your business decisions in the future.

Editor's note: This article has been updated to include the 10 most trusted brands based on Roy Morgan's Net Trust Score.