We like to think that we are independent thinkers — conscious of the world around us, yet unwavering to its influence. But are our decisions really ours?
To answer this question, we gathered business leaders to recreate a series of experiments by Professor Scott Heutell of Duke University.
Insight: People rarely behave in a fully reasonable way when it comes to making decisions.
Data: In the experiments we simulated, four out of five tests showed alignment with the principles in behavioural economics.
Key action point: Learn about how you can influence consumer behaviour by making small but ingenious changes to the context in which they make decisions.
Unlike other behavioural economics researches that are often criticised for only reflecting how university students respond within paid environments, we tested these same principles on some of Australia’s key business leaders without any financial incentive.
During our recent Alchemy event, we invited our 120+ guests to take part in a short quiz testing behavioural economics theories of framing and anchoring.
We had two test groups: Test A and Test B. Each had roughly the same questions but were seeded with different figures and images as primes. We wanted to see if participants would look to the environment for clues and cues when giving their answers. Though our sample size was arguably small, there are results that might still shock you.
Test A |
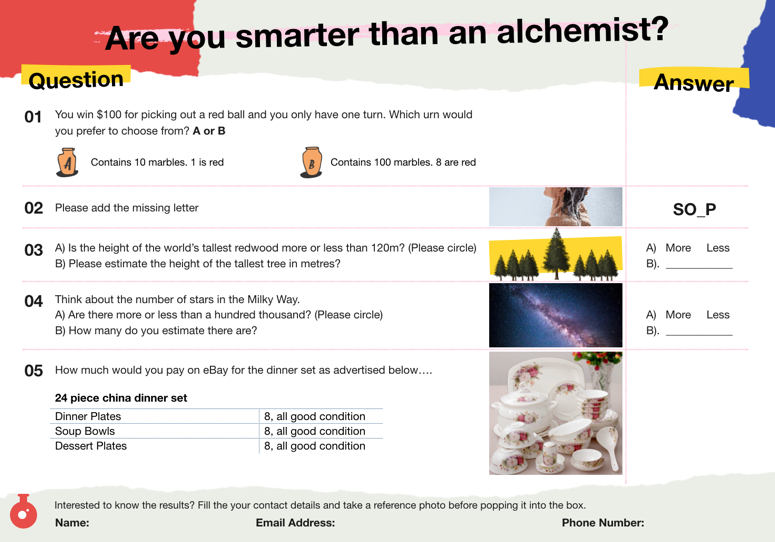
Test B |
|
|
|
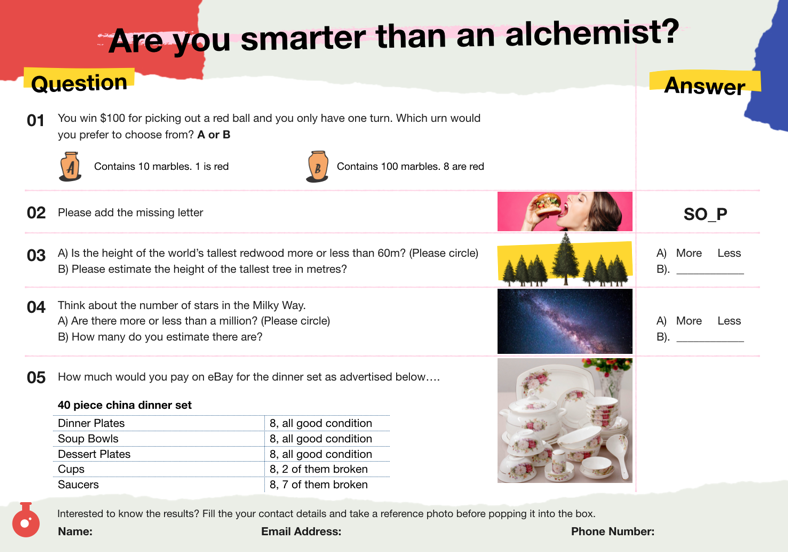
Question 1 was a control question, identical in both Test A and Test B, without any priming.
Participants were asked, “If you were able to win $100 by picking out a red ball from two hypothetical urns and you could only choose from one, which urn would you prefer to choose from: Urn A contains 10 marbles, only 1 is red while Urn B contains 100 marbles, 8 of which are red.
The results showed consistency with the preference for Urn A, which had a 2% higher probability to draw out a red ball. No bias was found.

The Hidden Drivers of Decision-Making
Making decisions is hard work. It takes up considerable amounts of energy to choose. Thankfully, we have a shortcut in the way we think and make decisions.
Through intuition and impressions, we can quickly make mental links to our existing knowledge base and summon related words and concepts. All of this happens incredibly quickly and unconsciously.
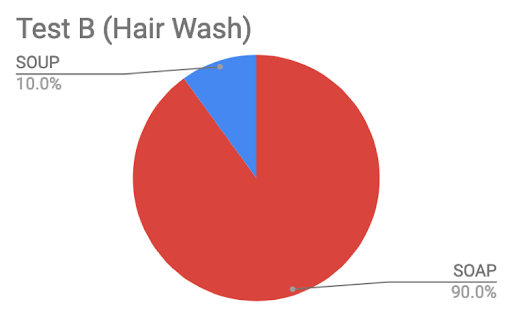
For our experiment, we asked respondents to add the missing letter to “SO_P”, testing whether exposure to a specific visual cue could or would affect their decisions.
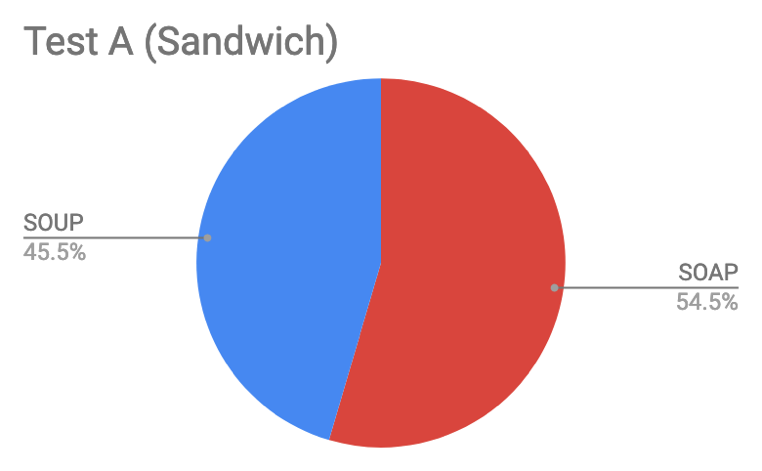
Test A had a picture of a sandwich while Test B had a picture of someone washing their hair.
When presented with the question, five times as many respondents answered with SOUP (instead of SOAP) when they were primed with the image of a sandwich!
Respondents unconsciously linked the sandwich to food and, thereafter, food to soup.
 |
 |
How Do You Weigh an Anchor?
Now that you are aware that the mind is unconsciously susceptible to priming, you might be thinking that you are safe when you use your rational mind. Surely it is able to analyse all factors before making a choice or determining a value?
Well, the truth is that perceptions linger in your mind and form an anchor. And by anchor, we are not referring to the heavy metal object used to moor a ship to the sea bottom. But rather, it’s the mental reference point that individuals tend to rely heavily on when making decisions.
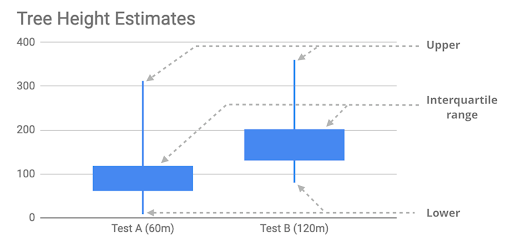
In our experiment, participants were asked if they thought the height of the world’s largest redwood tree reached more or less than a specific figure. Test A indicated “60m” while Test B indicated “120m”.
The answer itself was not the data we were most interested in. The gold is in the second part of the question where participants were asked to estimate the height of the tallest tree.
It turned out that both parties provided answers close to their respective anchors. Those who had an anchor of 60m had a median of 80m while those who had an anchor of 120m had a median of 150m.
For those who are curious to know the actual answer, the tallest tree in the world is named Hyperion, which reaches 115.7m.
This begs the next question: if we make decisions aligned to anchors, can we achieve similar outcomes if the anchor is considerably far off from the actual?
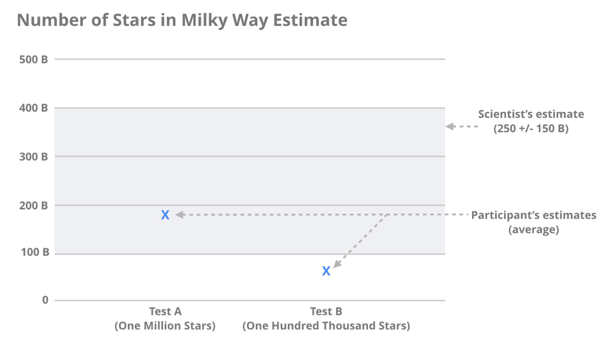
We asked participants to estimate the number of stars in the Milky Way. Test A participants were asked, “Are there more or less than a million stars in the Milky Way?” We followed that up with the question, “How many do you estimate there are?”
Test B participants had the same question but with an anchor figure of one hundred thousand. Both anchors were far from the 250 billion +/- 150 billion stars estimate scientists gave.
So with our mean/median analysis spitting out jumbled interpretations, we turned to James Surowiecki’s Wisdom of the Crowds methodology to reduce the volatility and skews. This removed the top 10% of outliers, then we averaged the rest.
Noting the low anchors for both, Test A’s mean estimate of 182 million stars fell within the range provided by scientists while the mean estimate of Test B was more than half lower than Test A’s with a mean of 65 billion stars. This reaffirms behavioural scientists’ hypothesis that people consistently don’t adjust enough from their anchors.
The Final Test: You Are Only as Valuable as Your Weakest Point
We then set out to see how value is assessed. Test A participants were asked how much they’d pay for a forty-piece china dinner set on eBay with thirty-one items in good condition and nine items either broken or chipped. Test B participants were asked how much they’d pay for a twenty-four-piece china dinner set with all twenty-four items intact.
Though they’d technically get more items in Test A, participants seemed to be willing to pay more for less. The median price Test A participants were willing to pay was $17, while the median price Test B participants were willing to pay was $25.
When it comes to assessing value, we average instead of add the additional value. That means bundling a cheap gift with an expensive product can actually devalue the whole deal. Less is more, in many cases.
Key Learnings
Interesting enough, out of Professor Scott Heutell’s five priming and anchoring collectives we replicated, four of the results showed alignment with behavioural economic principles. Our group was 50% less likely than the ‘average person’ to fall for the 100 marble urn mistake.
Based on these experiments, it turns out that we are far from being the independent, absolute thinkers we thought we were.
We make observations of the world around us, and that creates points of reference. So when it comes time to make decisions, we look to the environment for clues and cues. Oftentimes, these clues and cues are invisible and manifest in our unconscious mind. Yet we go back to those frames and anchors and make comparisons based on them.
Business Takeaways
-
Images come loaded with meaning. What images are you using on your website, brochures, and other collateral? Are they making the right associations to boost its place in the minds of customers?
-
Numerical anchors provide a frame of comparison and guide decision-making. What are yours? How does your price range affect customers’ decision making? What other prices are your customers comparing you to?
-
Adding extra stuff can reduce the value of your experience if it is not considered valuable to your audience. Are you adding any metaphorical broken bits of china to your product / service / value proposition?
Keen to know more about the other hidden drivers that influence our buying behaviours?
Authors
 Adeline Neoh is a Business Analyst at Step Change. She conducts research into current organisational systems, their employees, and customers to come up with insights and analysis and provide them with recommendations that bring them a step change. With a Masters of Business Administration from Macquarie Graduate School of Management, Adeline won first place in the Management Consultancy Living Case Study Challenge (2017) for Johnson & Johnson. She also worked as a Senior Event Manager in Singapore where she enjoyed coming up with unique ideas and bringing campaigns and events to life. Through that experience, she learned how to work in a fast-paced environment and become more adaptive.
 Ashton Bishop is the CEO at Step Change. He is Australia’s Predatory Thinker — an expert in pinpointing how businesses can grow by outsmarting their competitors. His niche is in strategy, where he has spent the last 14 years working internationally on some of the world’s biggest brands. He’s a business owner and serial entrepreneur; challenging, sometimes even controversial; but always focused on what gets results.